Transforming Data Into Decision
Engineered for Massive Data, Designed for Ease
Unlike traditional software that slows down under pressure, StatPro stays ultra-fast with even the largest datasets. Its advanced engine gives you real-time insights and stunning visuals without any heavy setup.
Why Stat-Pro Stands Above the Rest
Designed to turn complex data into clear, meaningful insights with unmatched speed, precision, and beautifully crafted visuals that elevate every analysis.
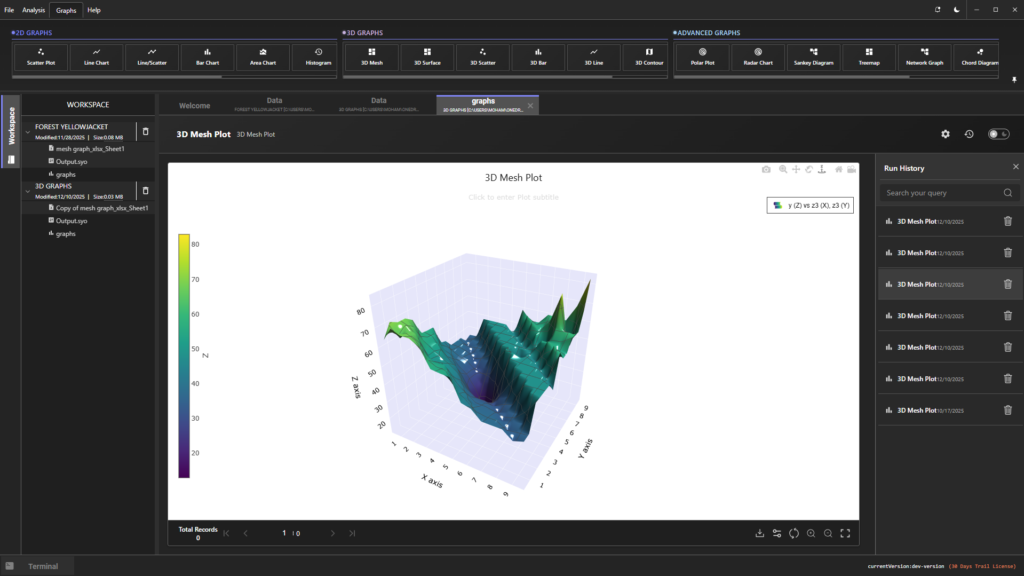
See More With Every Graph
Rich 2D and 3D visuals that uncover insights instantly and present them beautifully.
See More With Every Graph
Each visualization highlights patterns with exceptional clarity, making even complex relationships easy to interpret.
Effortless, Fast Analysis
Instant rendering and smooth navigation keep your workflow sharp and interruption-free.
Transactions made easy with app use
Even complex analyses feel effortless, letting you move from data to conclusions with zero friction.
Make Every Output Shine
Stunning, high-resolution visuals crafted to impress in reports, decks, and publications.
Make Every Output Shine
Deliver visuals that not only look exceptional but communicate your message instantly and effectively.
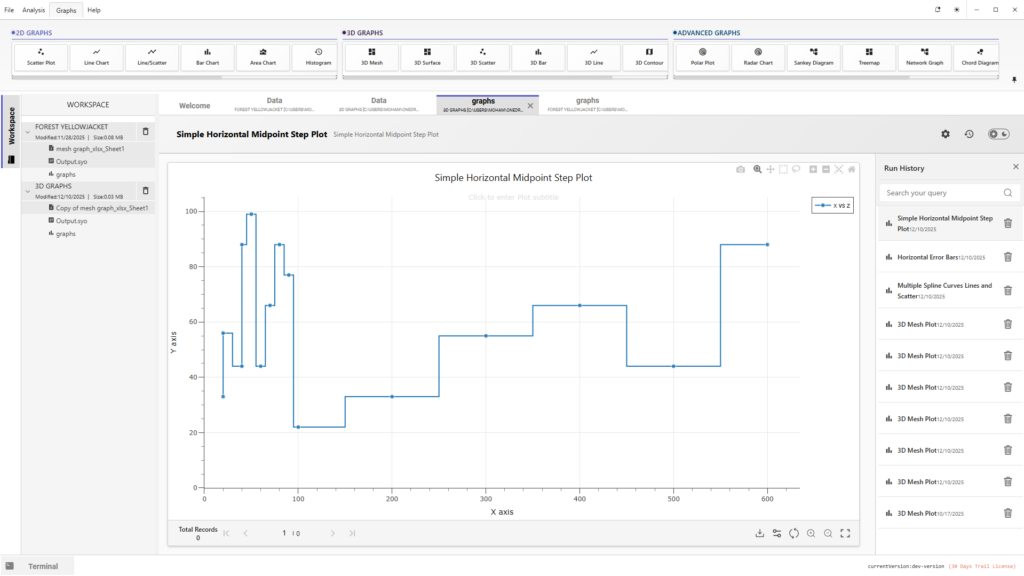
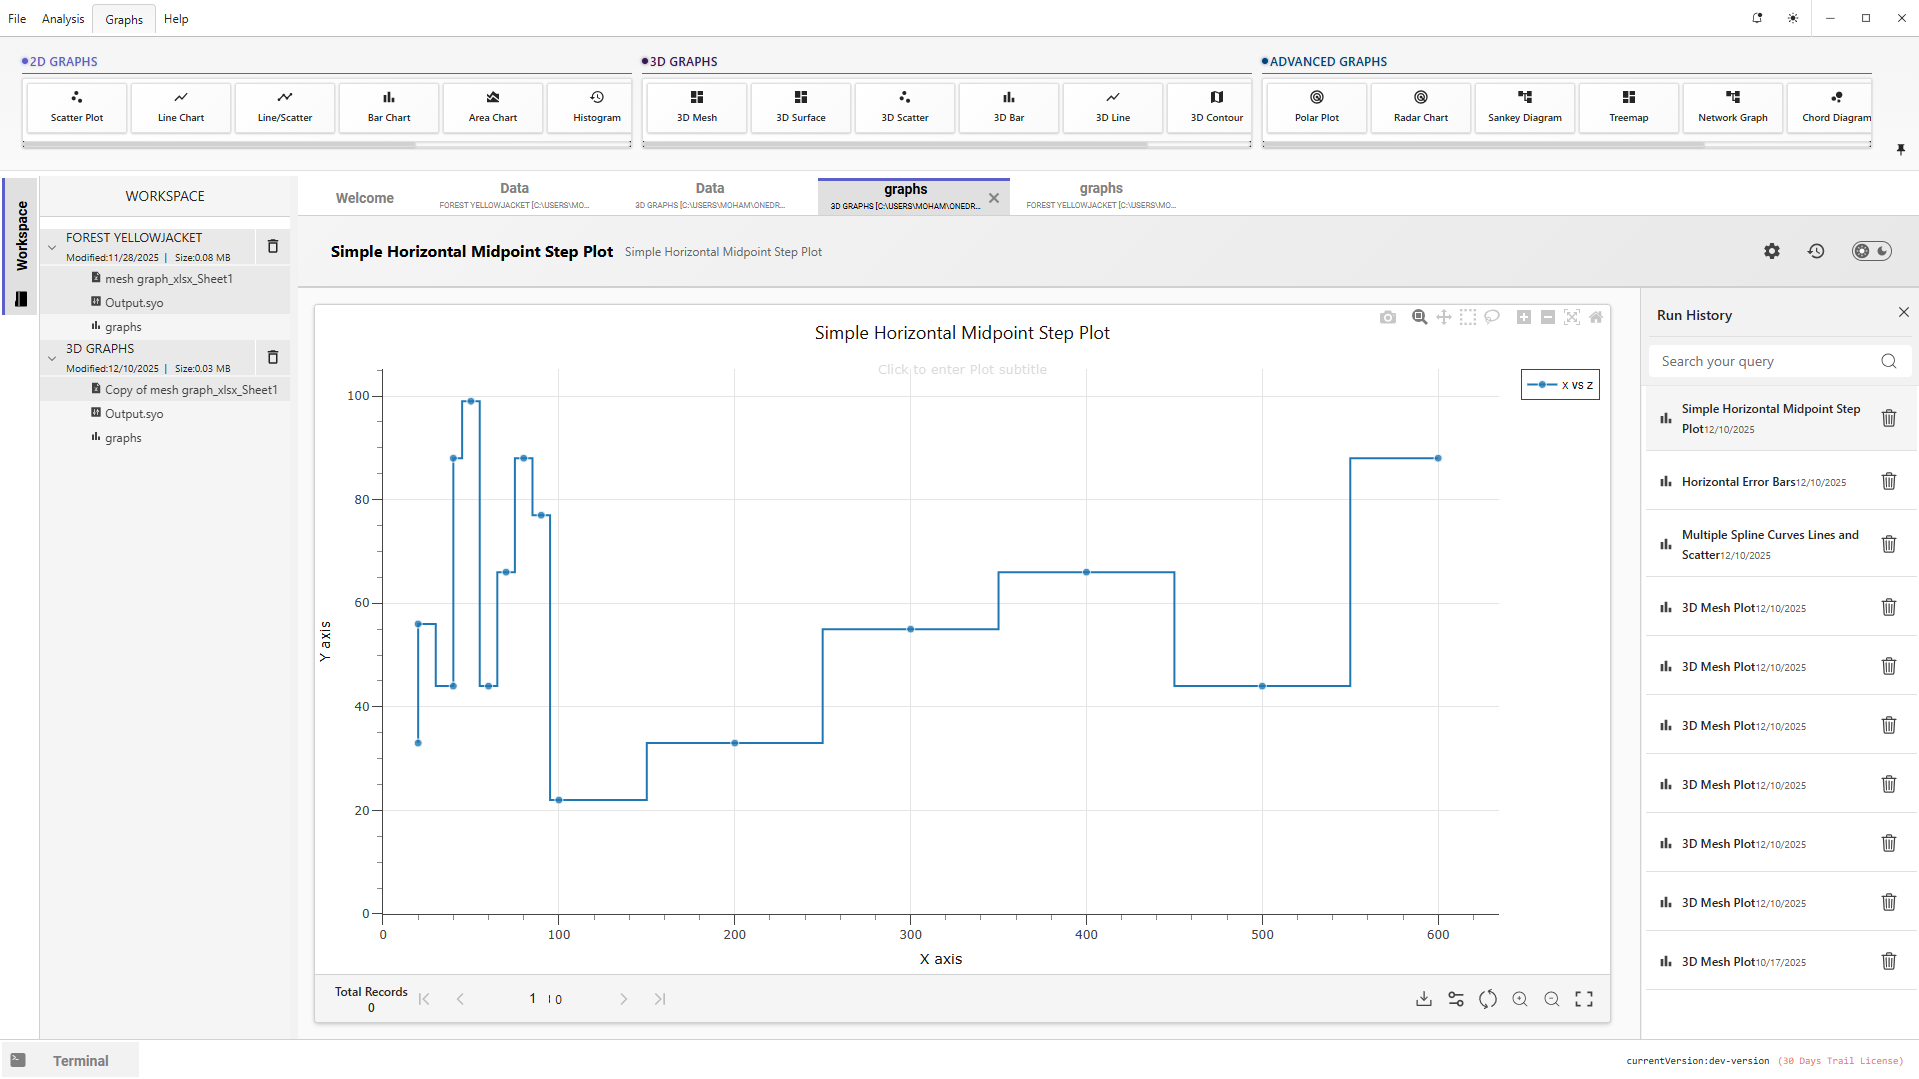
Transform Your Data Into Stunning Visuals Instantly
Create Beautiful 2D & 3D Graphs With Ease
Turn raw numbers into polished, presentation-ready visuals in just a few clicks. From clean 2D charts to immersive 3D views, every graph is designed to reveal patterns clearly and make your data visually compelling. No complexity — just smooth, intuitive creation every time.
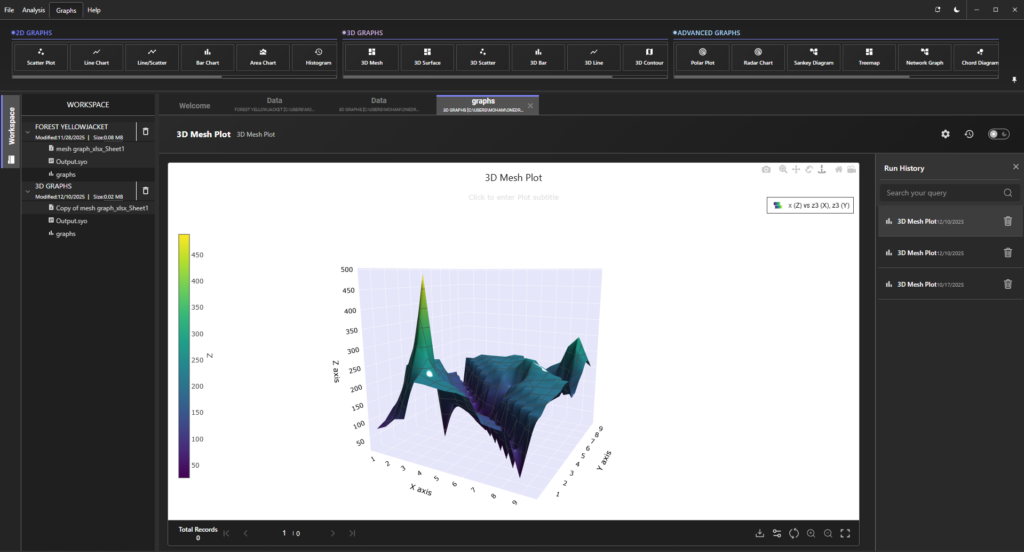
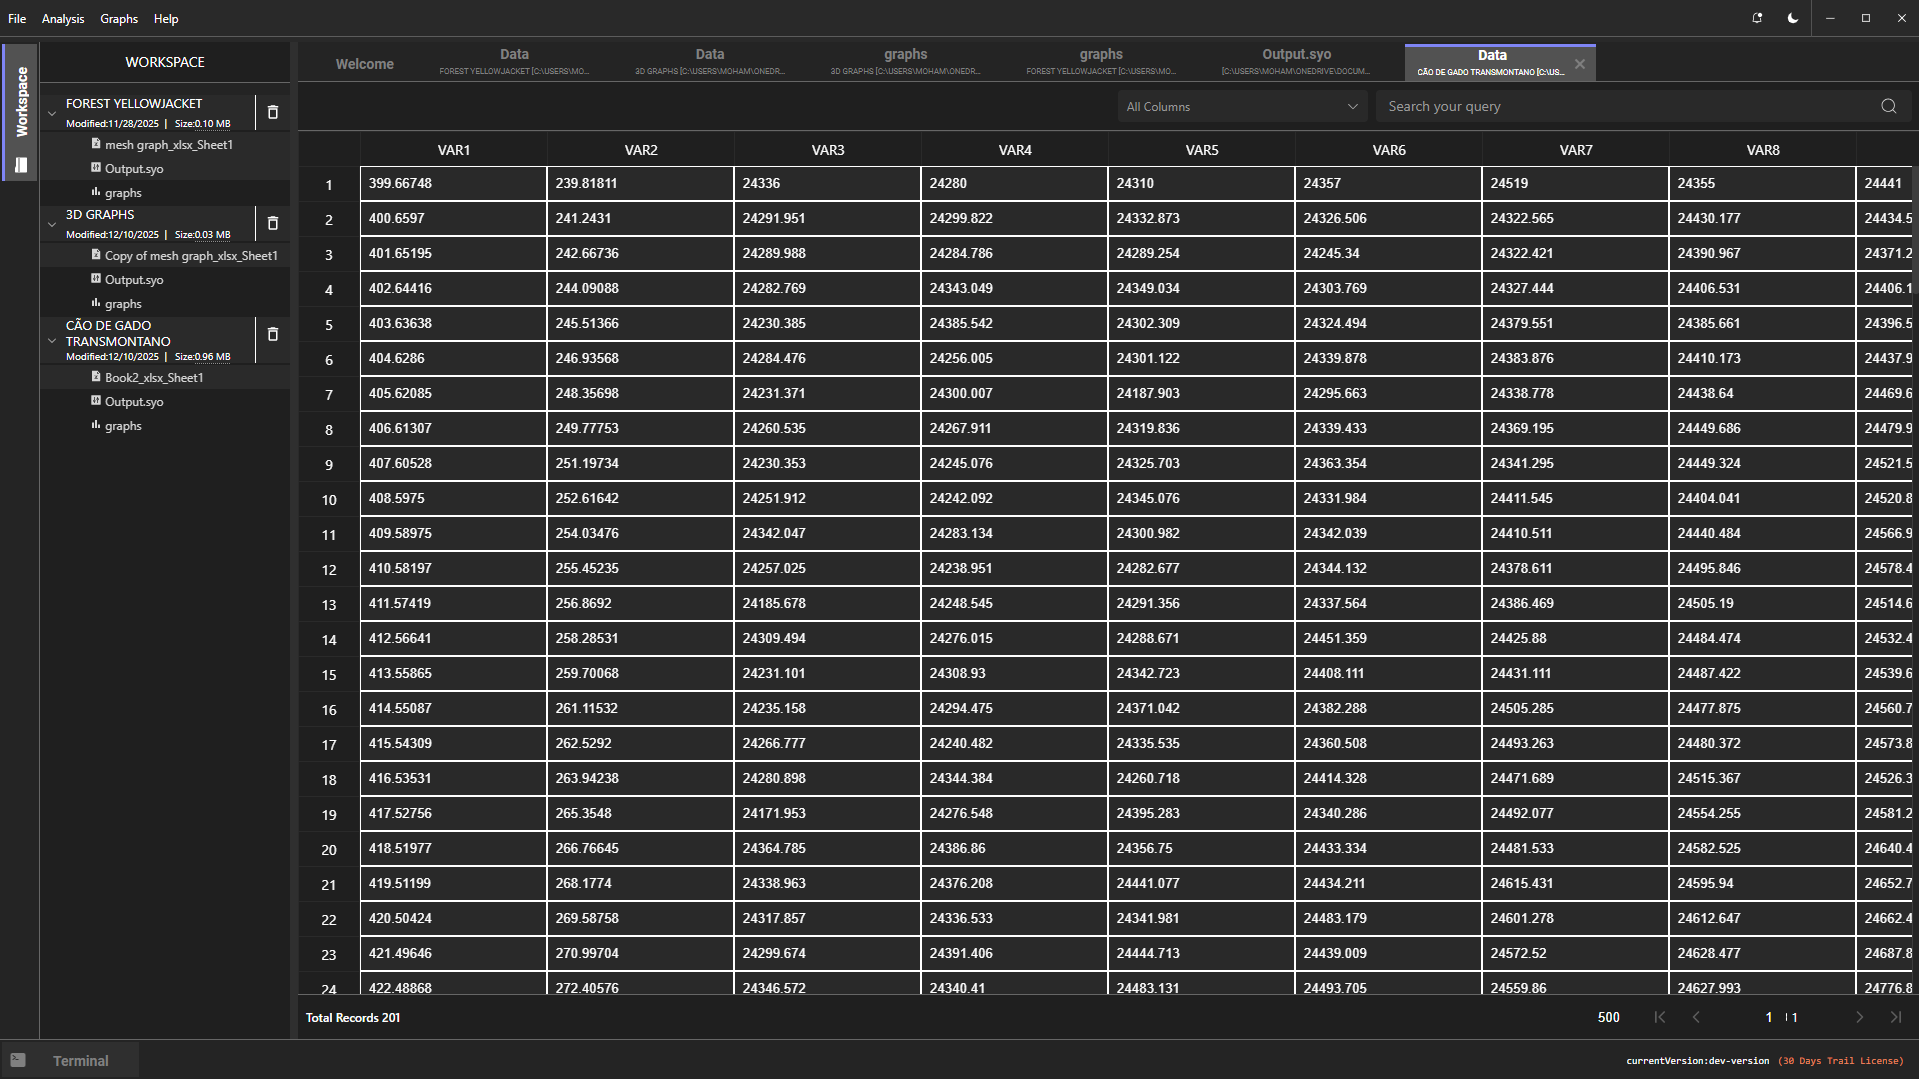
Handle Massive Datasets With Smooth, Fast Performance
Upload and explore large-scale data without lag or interruption. Interact freely with your visuals—zoom, rotate, filter, compare—while everything responds instantly. Whether you’re analyzing thousands or millions of data points, the experience stays seamless and powerful.
Graphs
0
+
Satisfied Clients
0
+
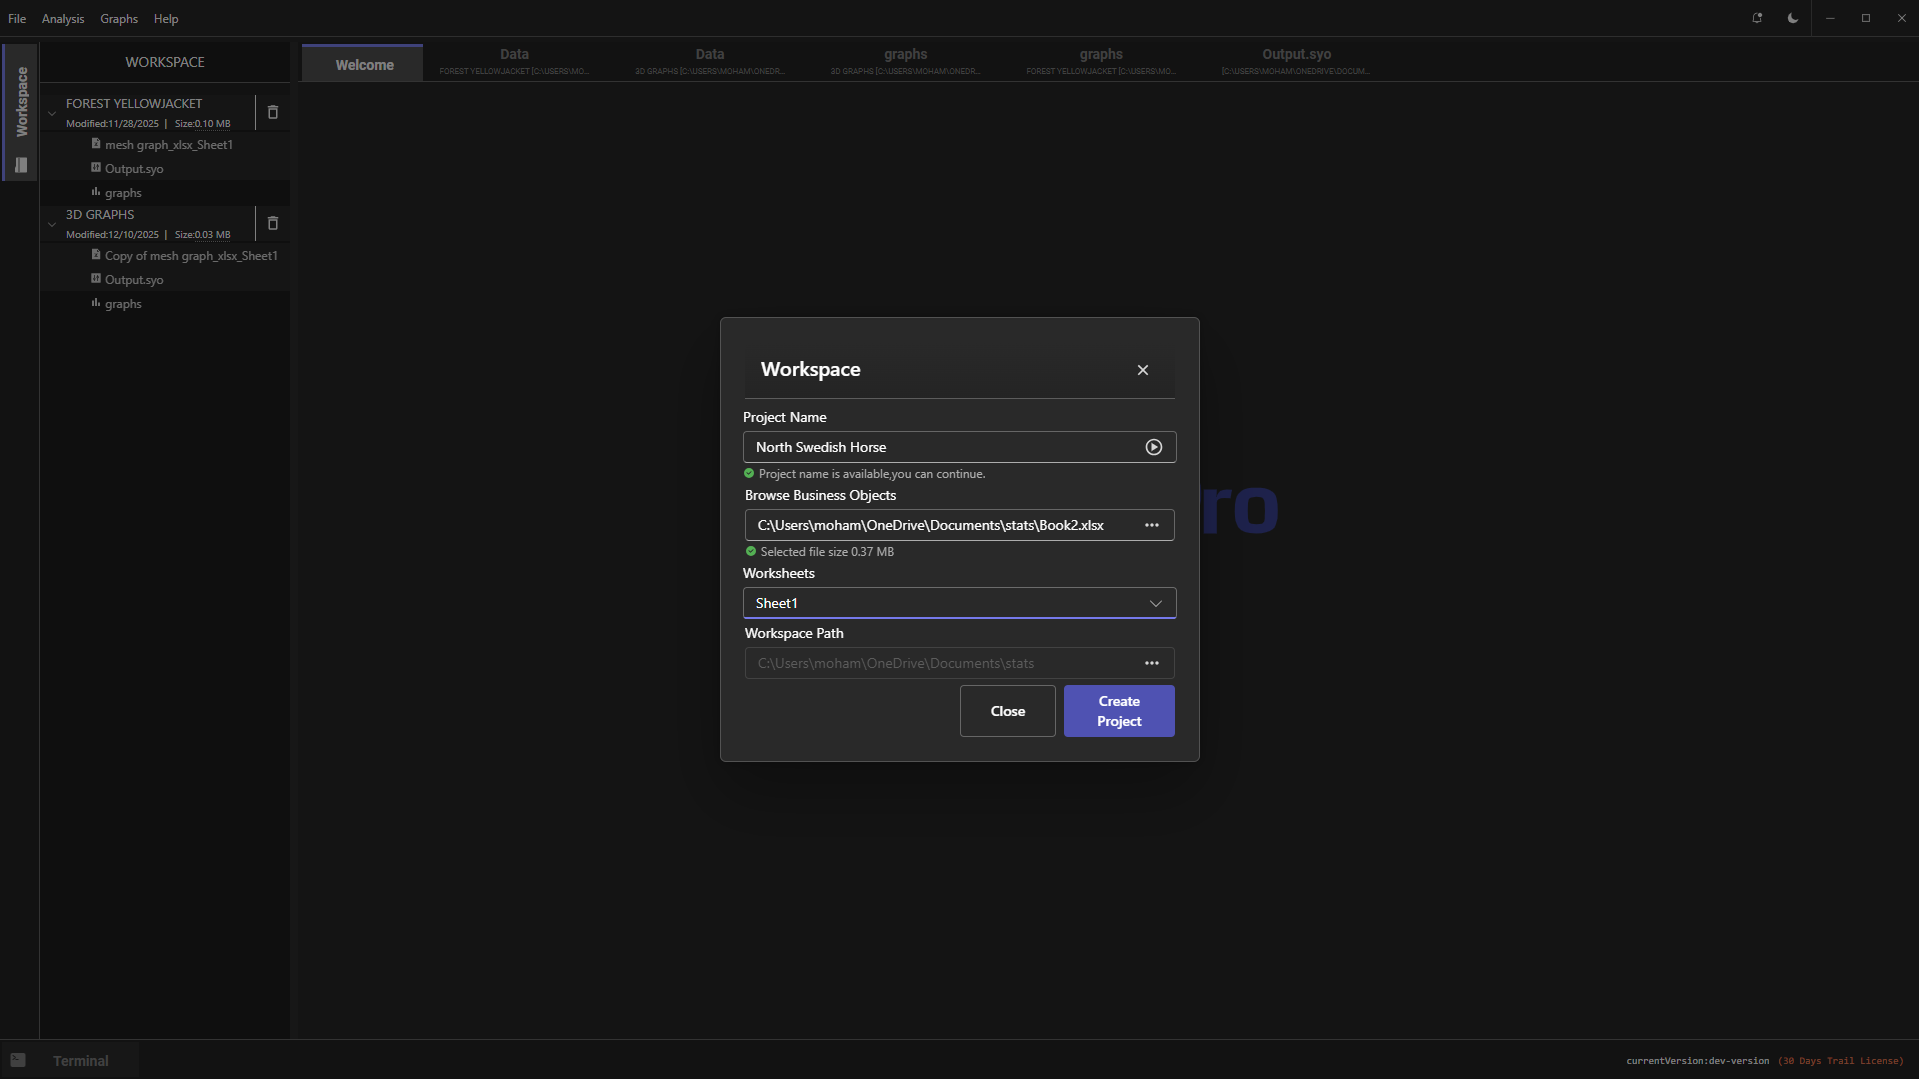
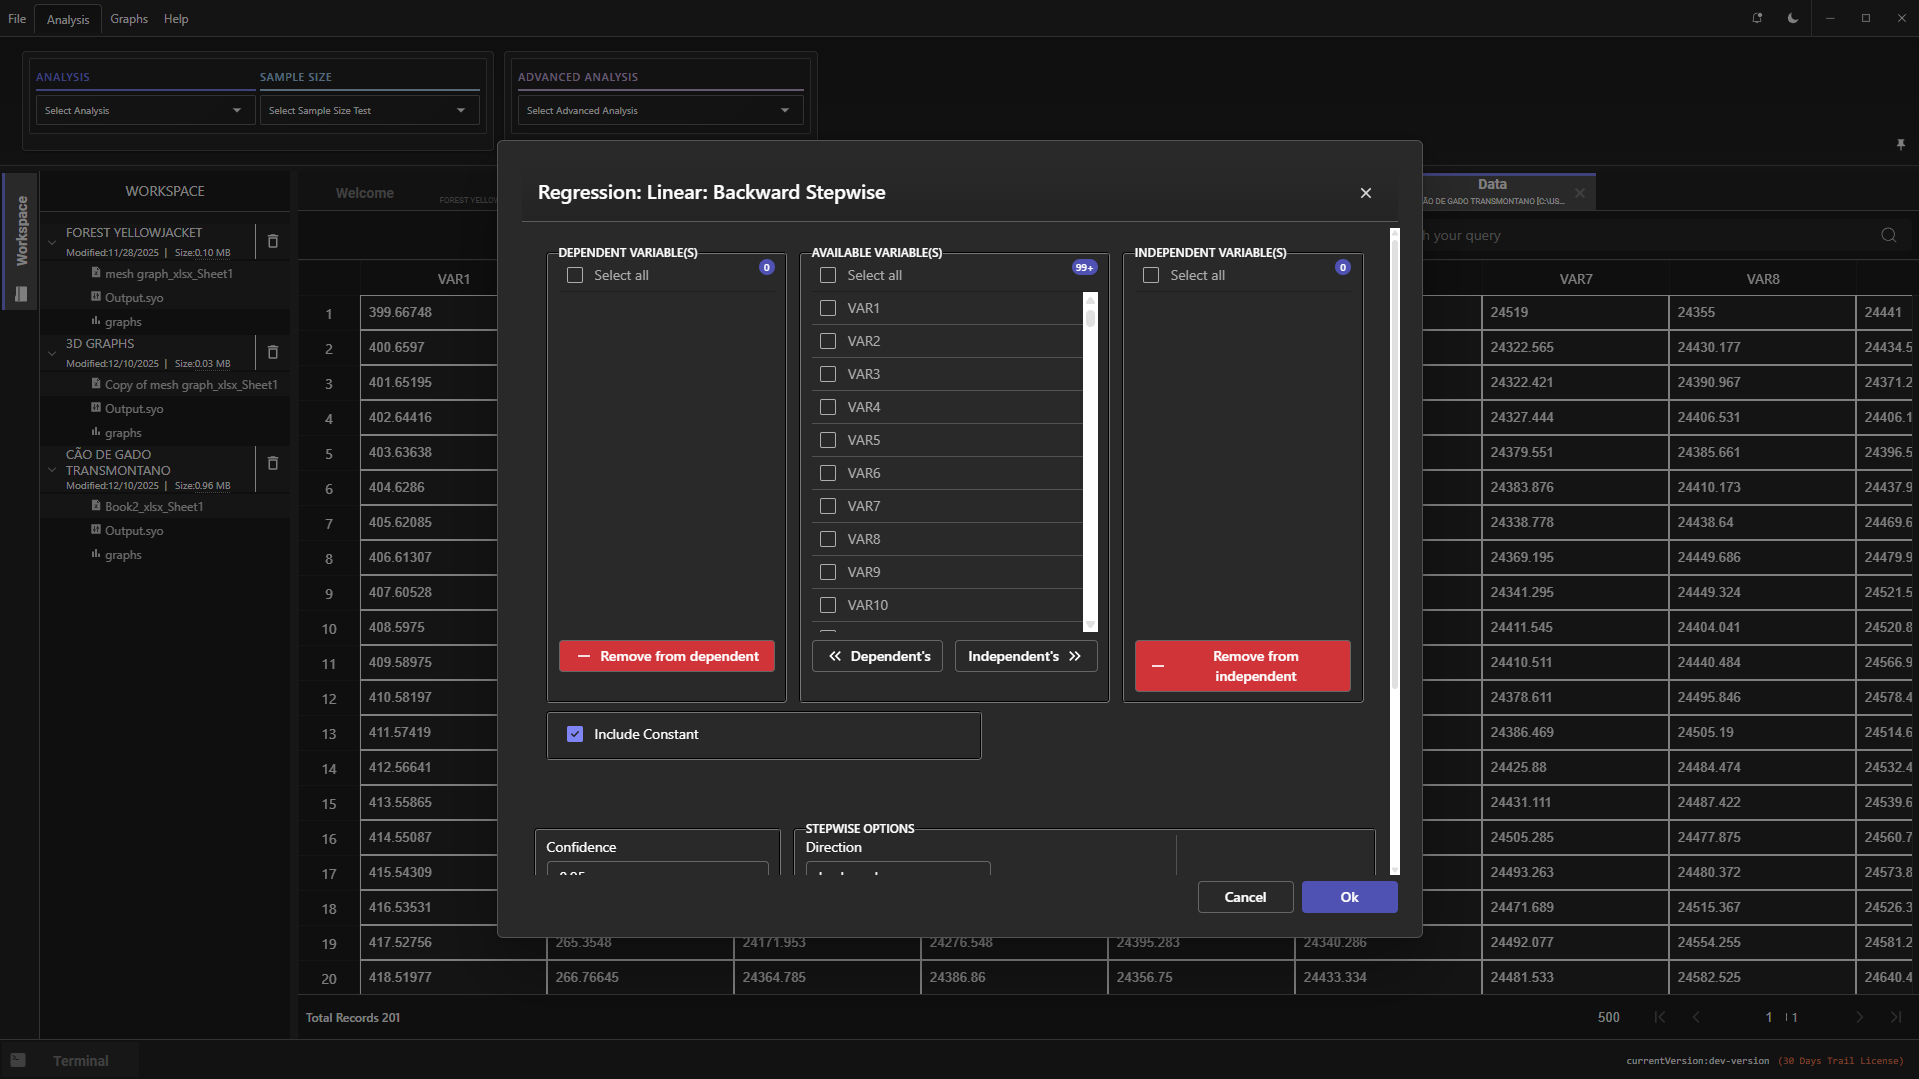
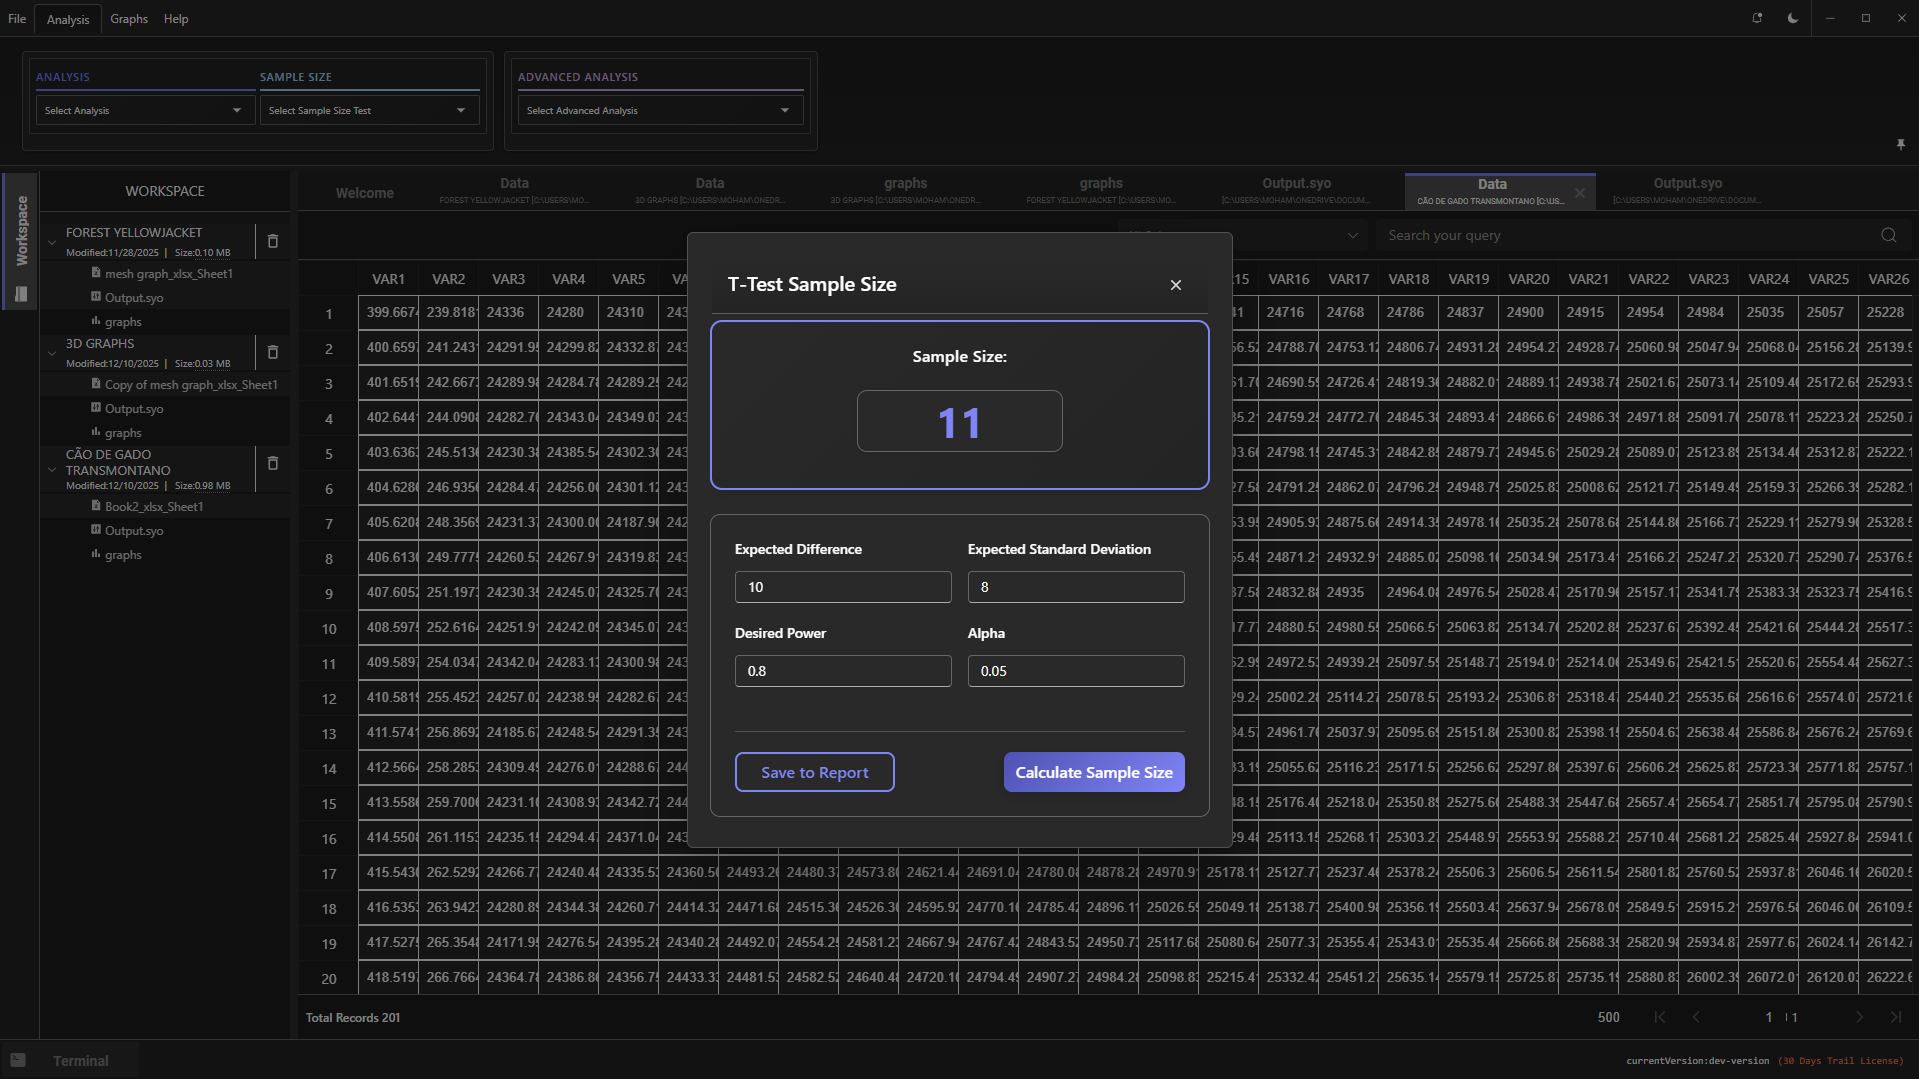
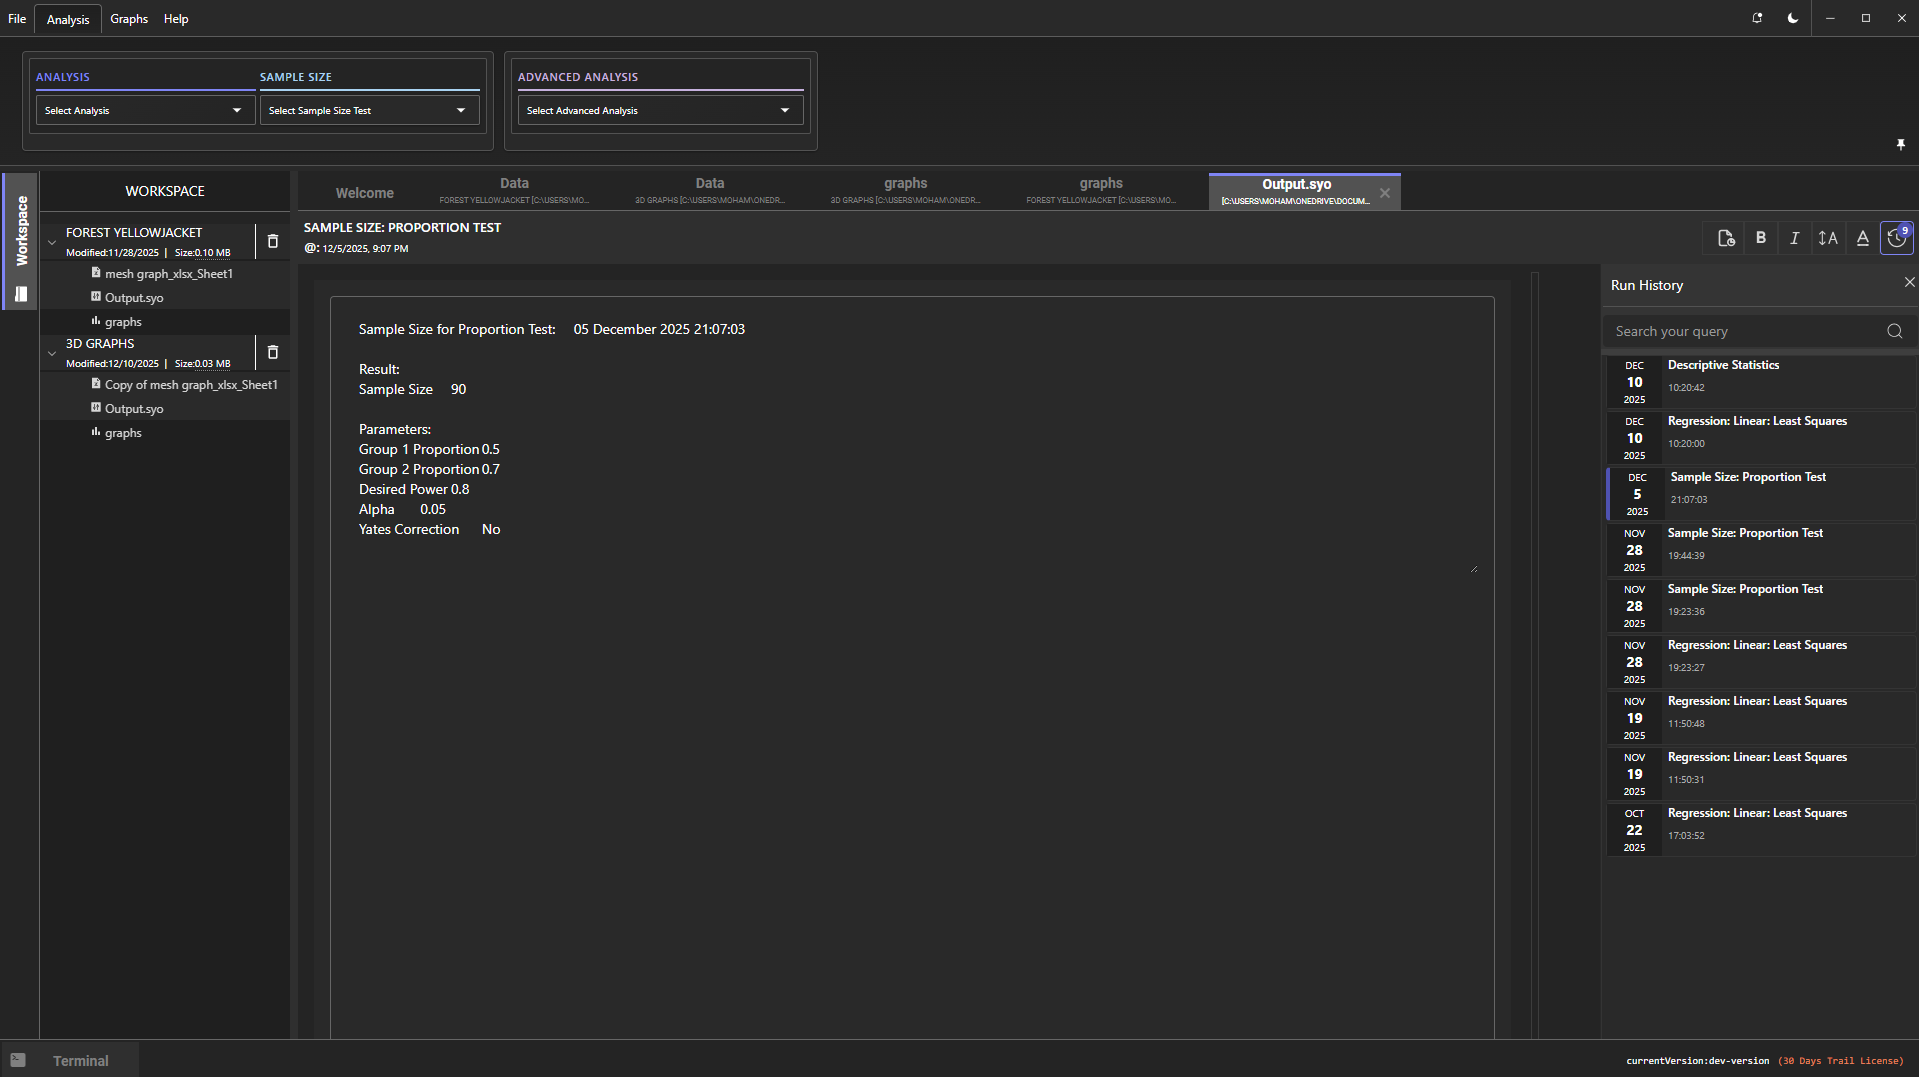
Run Powerful Analyses in Just a Few Simple Steps
StatPro makes data analysis effortless—from creating your project to generating beautiful, meaningful visuals.
With an intuitive flow and instant results, you can explore, analyze, and understand your data without complexity.
Create Your Project
Choose Any Analysis or Graph
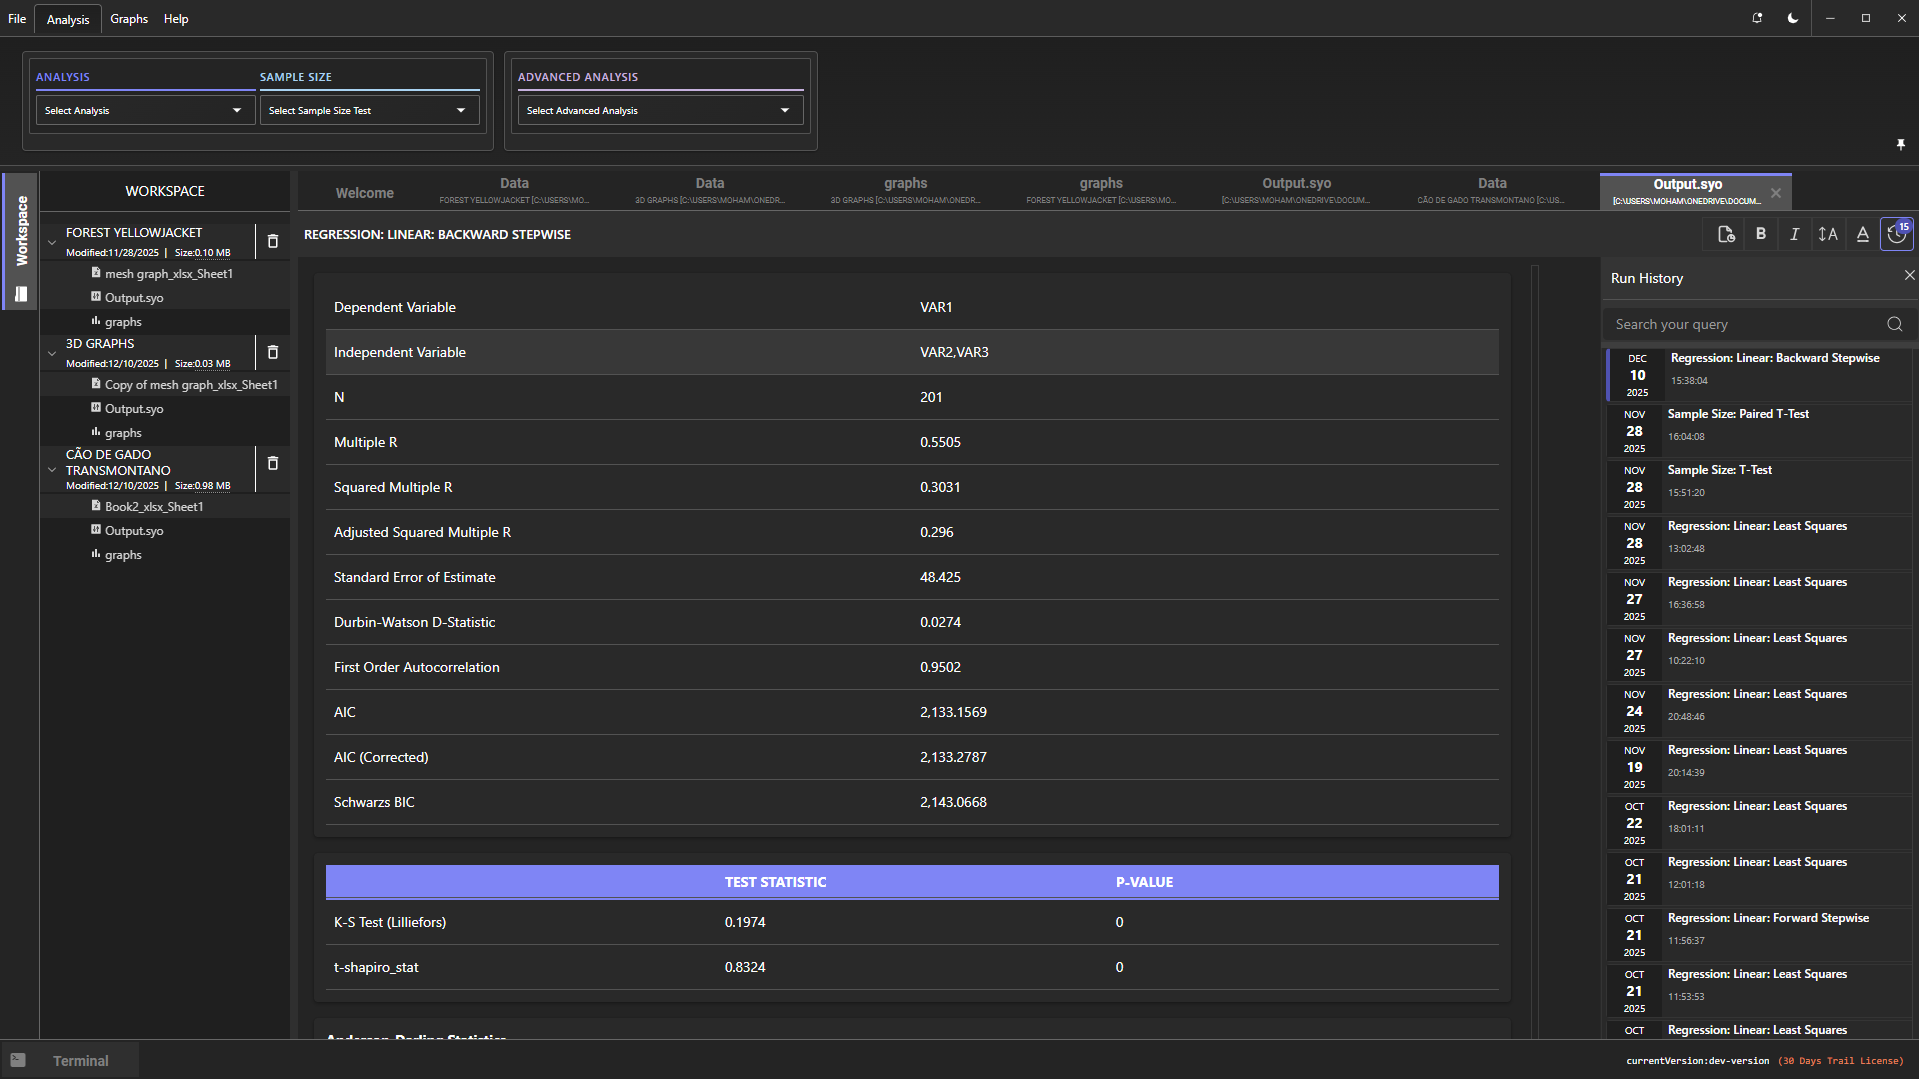
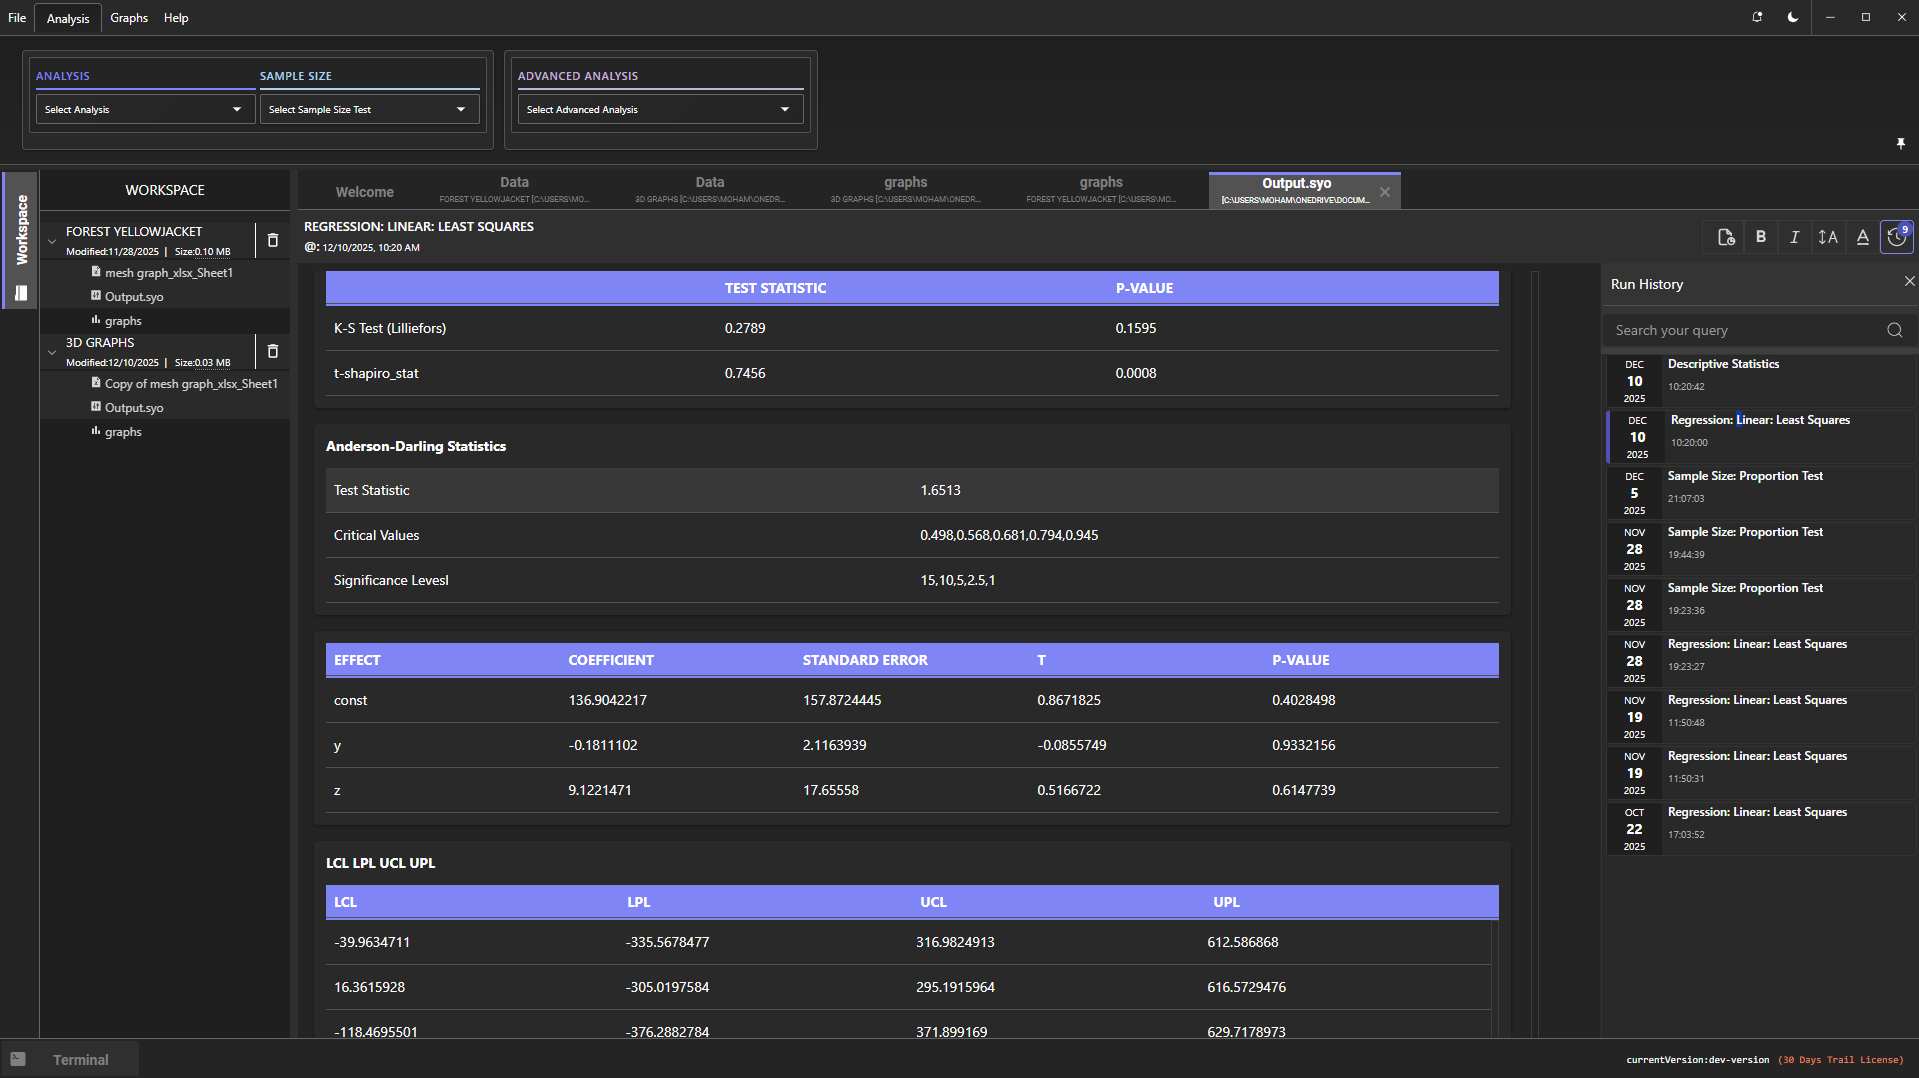
View Clear, Insightful Results

Pre-sale has already started
Experience effortless data analysis with powerful tools that turn your datasets into clear, meaningful insights.
StatPro delivers fast results and stunning visuals, helping you make confident decisions every time.
Frequently Asked Questions
Fusce felis elit, semper ac turpis ac, pulvinar consequat arcu. Nullam ac massa vel ipsum tempus tincidunt sit amet id ex. Nunc aliquet et quam sit amet feugiat. Suspendisse potenti. Nunc ut porttitor diam. Ut sed congue nisi
What is cryptocurrency? A guide for beginners
Nullam quis eros vel nisi fringilla consectetur. Vestibulum dapibus sapien non erat ornare vulputate. Suspendisse vestibulum mi ac mauris facilisis, viverra fermentum orci fringilla. Ut elementum congue tellus, ut viverra neque auctor vel
- Duis viverra erat in dolor placerat mollis
Mauris aliquam ligula elit, non lacinia eros mattis a. Vivamus nibh dolor, dictum ac tellus vitae, placerat fringilla nisi. Morbi tortor ex, sollicitudin in nibh a, bibendum euismod nulla. Sed non euismod neque. Orci varius natoque penatibus et magnis dis parturient montes, nascetur ridiculus mus
- Vestibulum gravida mi nisl, et vehicula tellus iaculis quis
Mauris aliquam ligula elit, non lacinia eros mattis a. Vivamus nibh dolor, dictum ac tellus vitae, placerat fringilla nisi. Morbi tortor ex, sollicitudin in nibh a, bibendum euismod nulla. Sed non euismod neque. Orci varius natoque penatibus et magnis dis parturient montes, nascetur ridiculus mus
What Is An ICO Token And How Does It work?
Duis ac odio dapibus urna elementum tempus. Donec quis mattis libero, at elementum felis. Quisque bibendum lacus eu turpis fringilla ultrices. Nullam quis eros vel nisi fringilla consectetur. Vestibulum dapibus sapien non erat ornare vulputate. Suspendisse vestibulum
- Morbi facilisis sodales velit, sit amet pellentesque
Mauris aliquam ligula elit, non lacinia eros mattis a. Vivamus nibh dolor, dictum ac tellus vitae, placerat fringilla nisi. Morbi tortor ex, sollicitudin in nibh a, bibendum euismod nulla. Sed non euismod neque. Orci varius natoque penatibus et magnis dis parturient montes, nascetur ridiculus mus
- Pellentesque suscipit nisl quis lacus auctor interdum
Mauris aliquam ligula elit, non lacinia eros mattis a. Vivamus nibh dolor, dictum ac tellus vitae, placerat fringilla nisi. Morbi tortor ex, sollicitudin in nibh a, bibendum euismod nulla. Sed non euismod neque. Orci varius natoque penatibus et magnis dis parturient montes, nascetur ridiculus mus
Need More Answers?
Pellentesque congue convallis rutrum. Quisque vel velit erat. In massa justo, lobortis in augue ac, molestie consequat mi. Fusce metus mi, pharetra a magna at, suscipit accumsan nisl. Nam sodales turpis vitae libero bibendum, et molestie diam imperdiet. In hac habitasse platea dictumst
- Solid variety of altcoin choices:
Nam consectetur odio et felis gravida, sit amet molestie magna blandit. Phasellus sed ullamcorper nisl, sed mattis ipsum. Morbi mollis nisi
- Extremely simple user interface:
Curabitur sollicitudin lorem a ex accumsan hendrerit. Nam ornare malesuada magna, quis gravida leo pulvinar vitae
Empower your research journey—request your personalized quote today and unlock the transformative power of StatPro
Request A Quote
Magnis dis parturient montes nascetur ridiculus. Congue mauris rhoncus aenean vel elit scelerisque mauris pellentesque